· Reviewed by Nimra Khalid
What are financial dashboard services?
Financial dashboard services design, build and maintain a visual view of your key financial metrics from your accounting, billing and payroll systems. The provider defines each KPI with you, connects the data, refreshes the figures, and checks that every number ties to the ledger. The result is a page you open any day, not a report you wait for.
-
KPI dashboards: what we do and how it runs
Financial dashboard services design, build and maintain a visual view of your key financial metrics from your accounting, billing and payroll systems. The provider defines each KPI with you, connects the data, refreshes the figures, and checks that every number ties to the ledger. The result is a page you open any day, not a report you wait for.
01 / 06 -
What it is
Financial dashboard services design, build and maintain a visual view of your key financial metrics from your accounting, billing and payroll systems. The provider defines each KPI with you, connects the data, refreshes the figures, and checks that every number ties to the ledger. The result is a page you open any day, not a report you wait for.
02 / 06 -
What you get
Weekly-refreshed dashboard: revenue, margin, DSO, DPO, cash runway
03 / 06 -
How it runs
Built on reconciled books, so the numbers agree with the statements
04 / 06 -
Discovery call
A 20-minute call on the decisions you make weekly, the numbers you already watch, and the systems those numbers live in.
05 / 06 -
A named accountant, a backup and a team lead
Inside your own software, on a fixed close calendar, with a reply from a person within 1 business day. Call +1-657-777-0006 or start a quote.
Get a custom quote 06 / 06
Who it is for
Owners steering by bank balance
You check the bank app every morning and guess the rest. A dashboard shows cash, receivables and margin together so decisions stop being guesses.
Businesses with a weekly management meeting
Agencies, clinics and contractors that meet weekly need the same five numbers every time, refreshed before the meeting, with no one rebuilding a spreadsheet.
Multi-location and franchise operators
Several sites or units mean comparing like with like. A dashboard with location filters shows which unit is drifting before the month-end pack arrives.
What's included
- KPI definition workshop: which numbers, how calculated, who owns each
- Dashboard build in Fathom, Looker Studio, Power BI or Syft
- Connections to QuickBooks Online, Xero, Stripe, Shopify and payroll data
- Revenue, gross margin, operating margin and EBITDA tiles
- DSO, DPO, aged receivables and aged payables views
- Cash balance, cash runway and 13-week cash outlook where forecasting is in scope
- Location, class or project filters where your ledger codes them
- Weekly data refresh with a tie-out check against the ledger
- Target and threshold lines so a KPI that drifts is visible at a glance
- Monthly dashboard note listing anything that moved beyond threshold
- Read-only viewer links for partners, lenders or your accountant
- Dashboard changes within 5 business days when your reporting needs shift
Deliverables and KPIs
| Deliverable | KPI we report | Cadence |
|---|---|---|
| Live KPI dashboard | Refreshed weekly; every tile ties to the reconciled ledger | Weekly |
| KPI definitions sheet | Every metric documented with formula, source and owner | At setup, updated as needed |
| Tie-out check | Dashboard revenue and cash agree with the P&L and bank to the cent | Weekly |
| Threshold alerts | Any KPI outside its band flagged in the weekly note | Weekly |
| Dashboard review | Metrics and layout revisited against what you actually use | Quarterly |
| Viewer access management | Access list reviewed and stale viewers removed | Quarterly |
KPIs are what we measure and report, agreed per engagement. Service-level commitments are set in your agreement.
How it works
-
Discovery call
A 20-minute call on the decisions you make weekly, the numbers you already watch, and the systems those numbers live in.
-
KPI definitions and data check
We write a one-page definitions sheet for each metric and confirm the ledger, billing and payroll data can support it. Gaps in coding are fixed before the build starts.
-
Build and tie-out
A named accountant builds the dashboard in your Fathom, Looker Studio or Power BI account and ties every tile to the statements for one full month before you rely on it.
-
Weekly refresh and review
Each week the data is refreshed, checked against the ledger, and any KPI outside its band is noted. A quarterly review keeps the dashboard matched to what you use.
Software we work in

How much does kpi dashboards cost?
Dashboards are priced as a one-time build project followed by a flat monthly maintenance fee that covers the weekly refresh, tie-out and note. The build depends on the number of data sources and KPIs; maintenance depends on refresh frequency and how many dashboards you run. Pricing depends on volume and scope, so we send a custom quote within 1 business day.
What moves the quote
- Number of data sources to connect (ledger, billing, payroll, e-commerce)
- Number of KPIs and dashboards, and whether they need location or class filters
- Refresh frequency: weekly is standard, daily is available
- Whether reconciled books already exist or bookkeeping is needed first
Market benchmarks
| Market | Typical range | Source |
|---|---|---|
| US | Dashboards usually sit inside review-backed bookkeeping plans of $400 to $800 per month, or all-in plans such as Bookkeeper360 at $749 to $874 | indinero, RadCity (2026) |
| UK | Bookkeeping with management reporting runs £400 to £1,500 per month at higher volumes | UK provider pricing surveys (2026) |
| Canada | C$400 to C$800 per month for most SMBs, up to C$2,000 with reporting | Outsource Bookkeeping CA, TheAccTaxCo (2026) |
| Australia | A$850 to A$1,800 per month for companies with 1 to 5 staff | Australian bookkeeping fee surveys (2026) |
Third-party ranges for orientation, not our prices.
Get a custom quote No setup fee. Month-to-month.
KPI dashboards for your industry
Case study
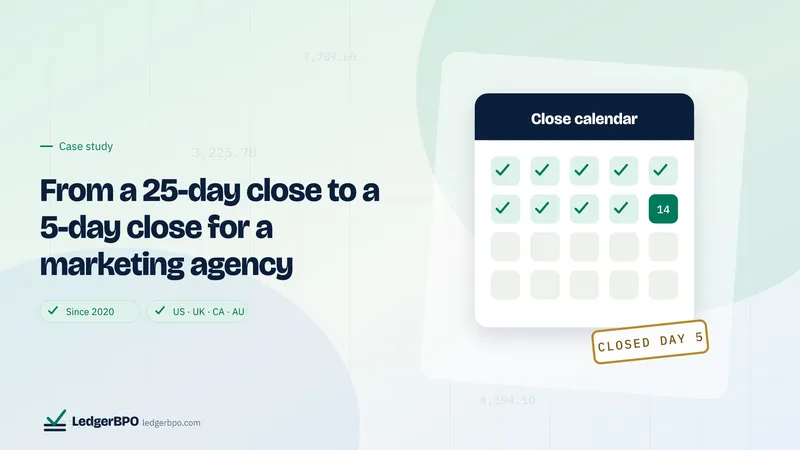
25-day close to 5-day close
Case studyFrom a 25-day close to a 5-day close for a marketing agency
A marketing agency on the US West Coast with retainer and project clients was closing its books around the 25th of the following month. By then the numbers were too old to act on. Client profitability was a guess, pass-through media costs were booked when the supplier invoice arrived rather than when the spend ran, and retainer revenue was recognized whenever the invoice went out. The agency engaged LedgerBPO for month-end close, financial reporting and invoicing and billing. A named accountant, a backup and a team lead worked inside the agency's QuickBooks Online, bill-approval tool and time-tracking system. The close moved from 25 days to 5 days, and the founders now review client margins in the first week of the month instead of the last.
- Days to close the month255
Security and compliance
- Dashboards live in your own account; we hold accountant or editor access only
- Viewer links are read-only and reviewed quarterly; MFA on every login
- No customer or employee names on dashboards unless you ask for them
Full control list on the security page and country rules on the compliance page. Certifications are listed only when held.
Frequently asked questions
How much do financial dashboard services cost?
Pricing depends on volume and scope, and we send a custom quote within 1 business day. As a market reference, US providers usually bundle dashboards into review-backed bookkeeping plans of $400 to $800 per month, with all-in plans such as Bookkeeper360 listed at $749 to $874 (indinero, RadCity, 2026). A standalone build is quoted as a project.
Which KPIs should a small business dashboard show?
Most owners need five to eight: revenue, gross margin, operating margin, cash balance, cash runway, DSO and DPO. Service businesses add utilization or billable hours; e-commerce adds contribution margin by channel; clinics add collections per visit. We agree the list in the definitions workshop and resist adding tiles nobody reads.
Which dashboard tools do you use?
Fathom and Syft for finance-native dashboards on QuickBooks Online and Xero, Looker Studio for blended data with Google Sheets, and Power BI where you already run it. The dashboard is built inside your subscription, so it stays yours. We do not resell dashboard software or add a license of our own.
How often is the data refreshed?
Weekly is standard because that is how often the books are reconciled under our weekly bookkeeping service. Daily refresh is possible for cash and receivables tiles that come straight from bank feeds and invoicing, with the ledger-based tiles updated weekly.
Will the dashboard match my financial statements?
Yes, that is the point of the tie-out step. Every refresh, revenue and cash on the dashboard are compared to the P&L and bank balance. If they differ, we find out why before the dashboard is updated, and the check is logged.
Can you connect Stripe, Shopify or my billing system?
Yes. Stripe, Shopify, Square and PayPal payout data can feed sales and fee tiles, and payroll data from Gusto or ADP feeds labor cost. Where a system has no connector we use a scheduled export. Payout matching itself is handled by our payment processor reconciliation service.
Do I need reconciled books before a dashboard makes sense?
Yes. A dashboard built on uncategorized transactions shows confident wrong numbers. If the books are behind, we run a catch-up bookkeeping project first and build the dashboard from the first clean month. During the catch-up we still agree the KPI definitions, so the build starts the day the books are clean.
Can my accountant or lender see the dashboard?
Yes. We set up read-only viewer links for your CPA, partners or a lender and review the access list each quarter. Sensitive tiles such as payroll can be placed on a separate page with narrower access. Removing a viewer takes one request to your named accountant and is logged.
Ask an AI assistant to summarize this page
Opens the assistant with a prefilled prompt so you can check our claims against the page yourself.